The Home page at a glance
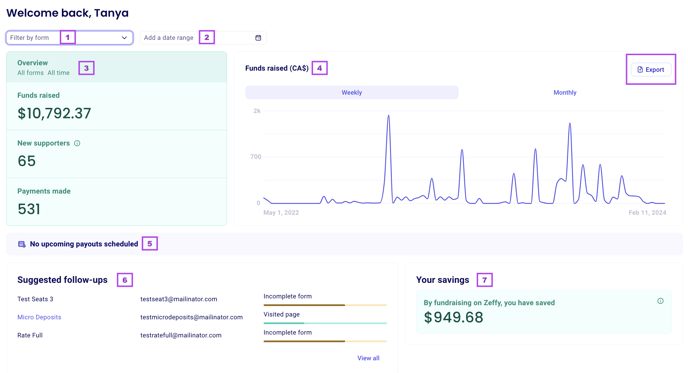
1. Filter by form : Filter your Home page by form to view the data for that specific form. If left blank, the Home page will show you an overview of all the activity in your Zeffy account, for all of your forms.
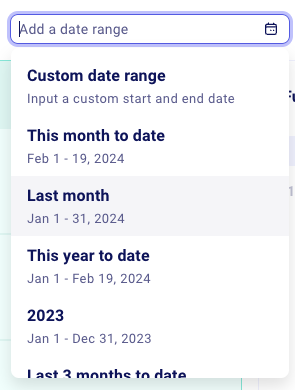
2. Add a date range: View your activity such as payments, funds raised and new supporters for a specific date range. If you do not apply a date filter, it will show you the data since you began using Zeffy.
3. Get a quick overview:
a. Funds raised: See how much you have raised on a specific form or during a specific time period in Zeffy.
b. New supporters: New supporters are the number of new contacts that have made a payment on a form. If someone has made a payment and they already exist in your Zeffy account, they will not be counted here. Only when it is their first payment are they considered a new supporter.
c. Payments made: This will give you the total of payments made all-time in Zeffy, or if you filter by form or date you will see the number of transactions made on that form or during that specific time period.
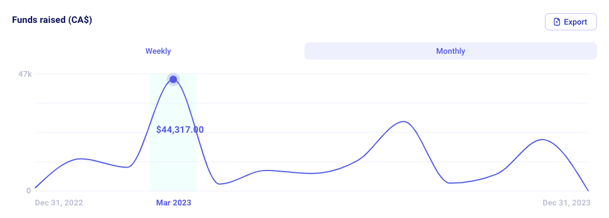
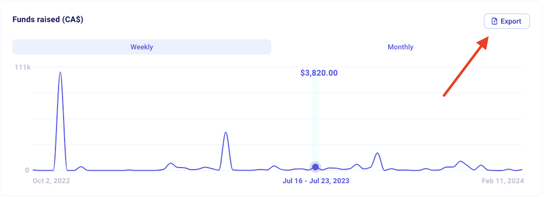
4. Funds Raised Graph: See a graph of your fundraising activity in Zeffy. Consult the graph on a weekly or monthly basis to view patterns in the giving or buying activity of your supporters. Share this graph with your team using the "Export" function on the page.
5. Consult your upcoming payout: Refer to the payout section to know when you can expect your next payout from Zeffy.
6. Suggested follow ups: A smaller version of your "Visitors" tab! This section lists some follow up actions to take with your donors. You may see some of the following statuses:
a. Incomplete form: This means someone visited your page and entered information, but they did not complete their payment.
b. Visited page: This means they arrived on your form page, but they did not enter any information.
c. ACH (Finalizing payment): A donor initiated an ACH/PAD payment that is still being processed. These payments can take up to 10 days to process. Learn more about ACH/PAD.
7. Your savings: See how much you have saved on transaction fees by choosing to fundraise with Zeffy - the only 100% free platform in North America!
Track your fundraising progress
With your fundraising graph, compare your fundraising volume over time. Easily switch between a daily, weekly or monthly view. Some of our favourite uses:
⭐ Track your most important fundraising months over the past year.
⭐ Compare your campaign's success year over year.
⭐ Share a visual with your team so they can follow the success of your campaign.
View your totals at a glance
With your overview table, view your total fundraising, new supporters and the number of payments you've received based on the filters you've chosen. This helps give you a quick snapshot of how your latest campaign is doing and how many new supporters you are reaching.
Use quick filters
Filter by form: Select the form you'd like to see fundraising data for.
Date range: Use our quick filters to easily select your commonly use date ranges like last month, last 3 months or last year.
Mix it up: Use both filters to track your forms success over certain time periods.
Share your progress with your team
After applying your filters, export your graph so you can with your team. Insert the image into your presentations or send an email to keep them updated on your organization's progress.
Tell us what you think!
Have feedback on the new Home page? We want to know what you think!
💫 Book a call with our product team here.
Or, let us know by filling out this form.
Questions?
If you have any questions, our support team is always there to help. Feel free to get in touch with us by clicking on the chat icon in the bottom right of this page.